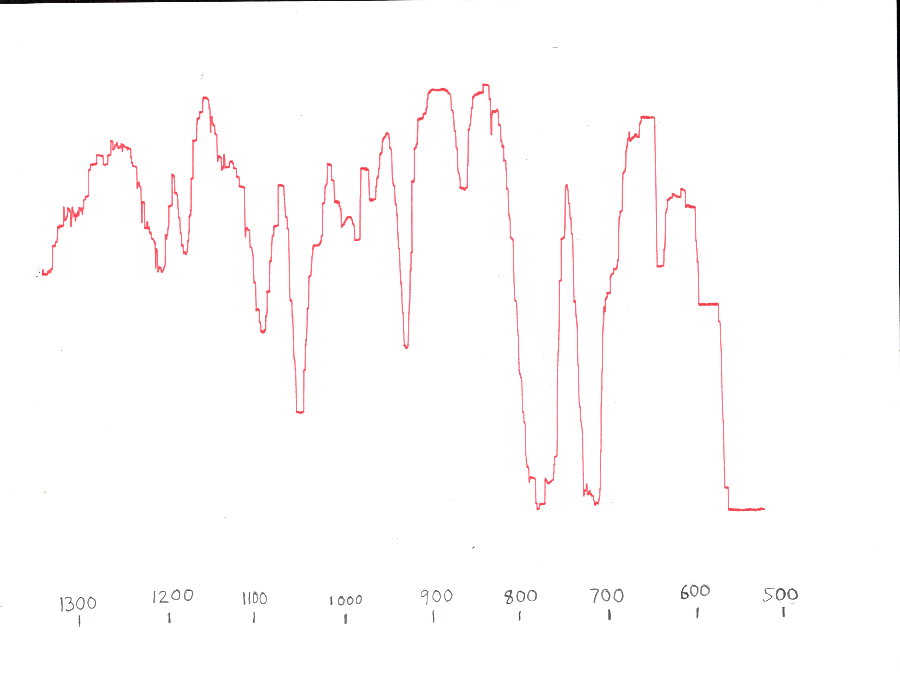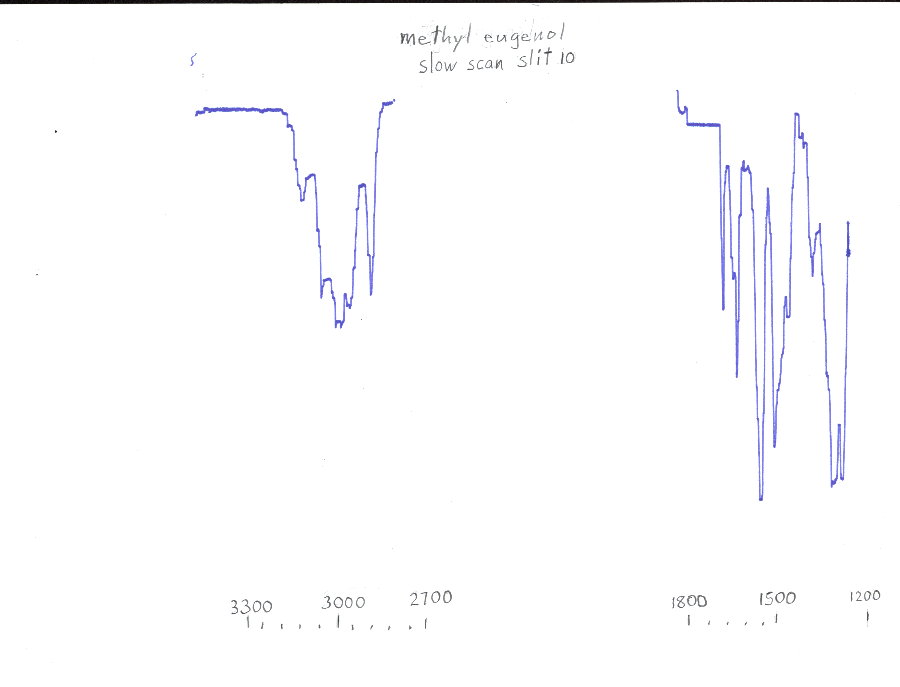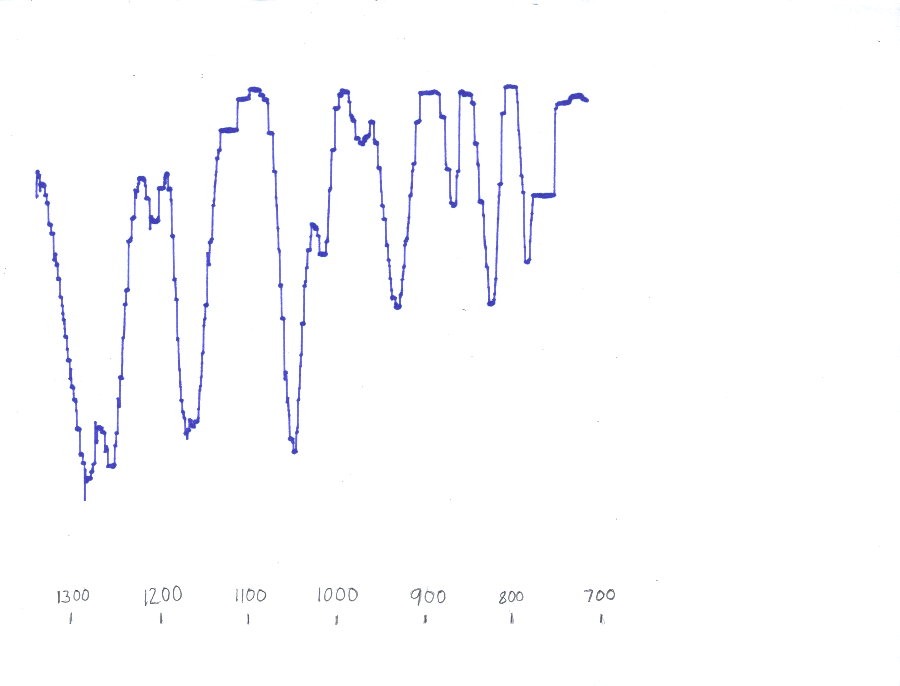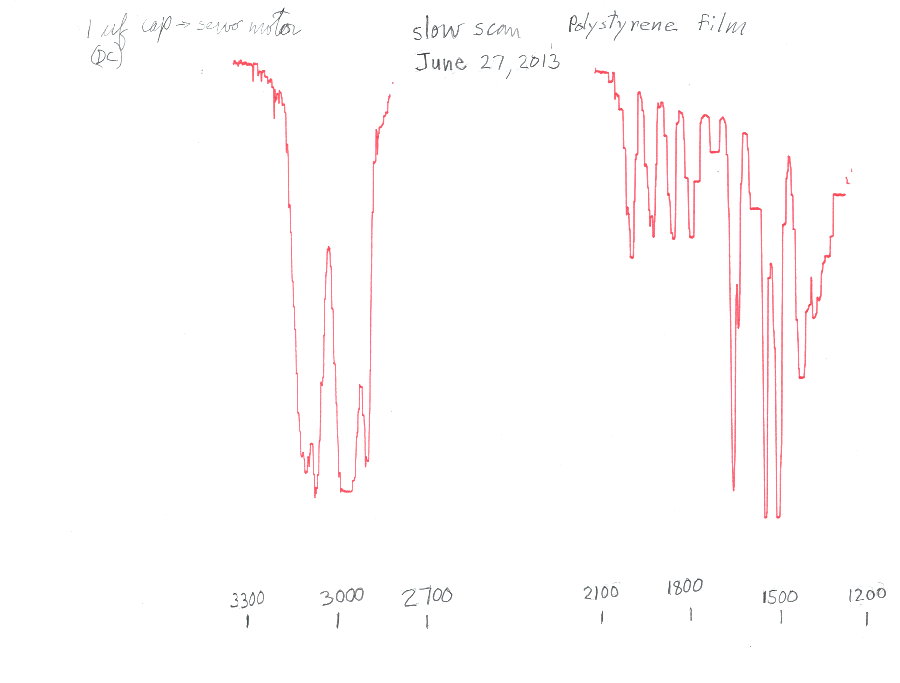
The Perkin Elmer 337 divides the spectra into two ranges similar to the 237. With the 337 the first chart covers from 4000 to 1200 cm-1 and the second chart covers 1333 to 400 cm-1. The first and second images are polystyrene film spectra done with the 337 discussed on this website and the third and fourth are methyl eugenol spectra done with the same instrument. The detector in the 337 discussed here is limited to about 700 to 600 cm-1. A sticker on the detector says "BaF2" on it so apparently it has a barium fluoride window which is limited to this range. The detector was taken from a Perkin Elmer 710. On the first charts (first and third images) only the useful parts of the spectra were scanned to save time. The tendency of the chart recorder to constantly stop and start causing a stair stepped appearence in parts of the spectra can be seen in the spectra below. Fast scan produces smoother recordings, but with less resolution. The slit has to be set at 8 to 10 (wide open) which apparently is due to the weak detector used in this instrument. Resolution isn't too bad even with the slit wide open.
Compare to the standard spectra of polystyrene and methyl eugenol (4-allyl-1,2-dimethoxybenzene)
polystyrene standard spectrum
US patent 3448268 fig. 6
polystyrene standard spectrum Perkin Elmer
Perkin Elmer 237 ad
methyl eugenol standard spectra
Spectra Compared -- The spectra were organized here for better comparison with the standard spectra.