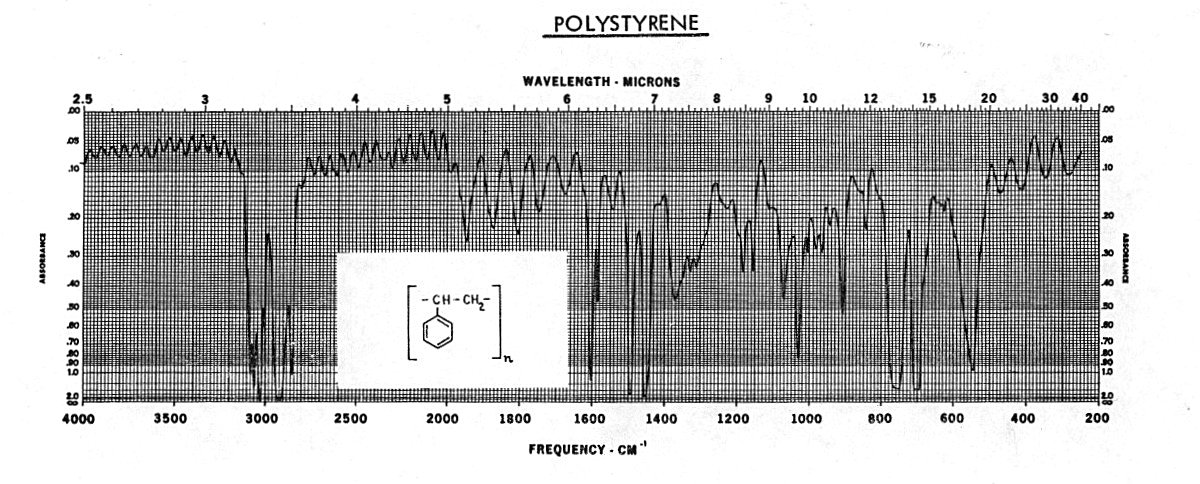
The first and second charts were combined into one image so they can be compared easier with the standard spectra. The 337 charts are linear with respect to wavenumber or frequency (scale under the spectra), but the length of the frequency scale on the first and second 337 charts are different. Note that the part of the 337 spectra between 1200 and 1333 cm-1 is repeated.
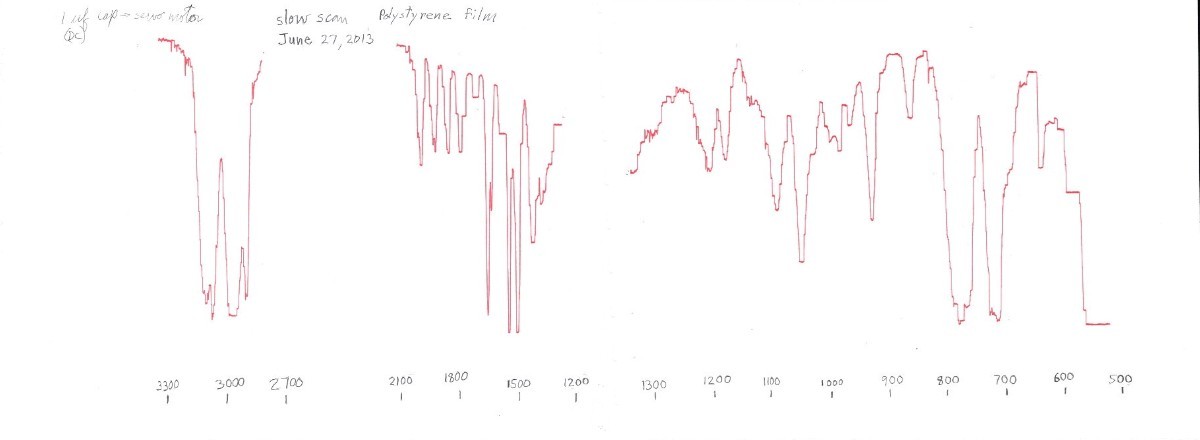
Comparison of polystyrene spectra made with the 337 and a standard spectrum

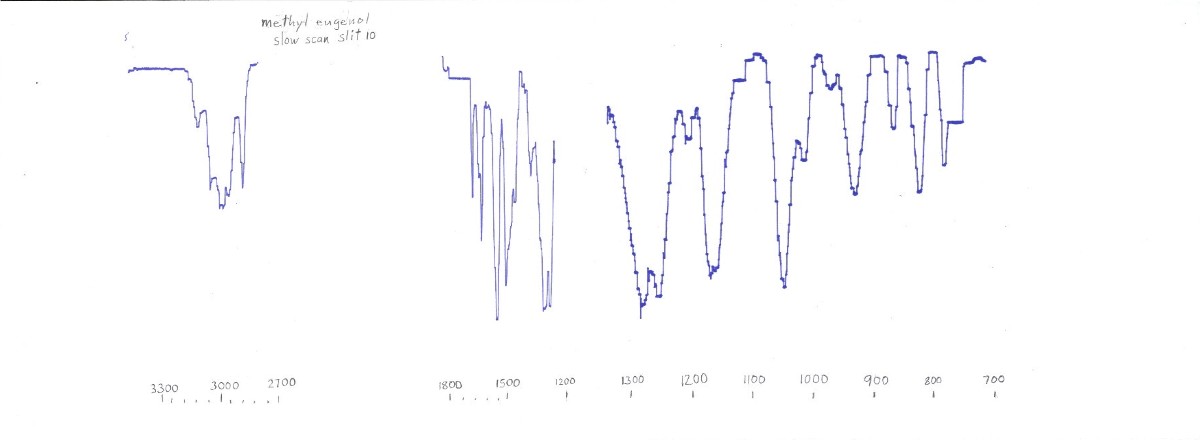
Comparison of methyl eugenol spectra made with the 337 and a standard spectrum