|
1. Editorial
Historically, Infrared and other sorts of spectrometer were huge, heavy expensive beasts and then along came the first small instrument – the Perkin Elmer Infracord. Nothing has been the same since. One of the team who developed the Infracord and its successors was Mike Ford, long retired director of research at Perkin Elmer’s UK plant. I have persuaded Mike to write a piece telling us about this revolution in instrumentation. Mike was helped by a wonderful character – Francis Dunston, again a P-E retiree, who has a house and garage full of ancient spectrometers and filing cabinets stuffed with brochures and other memorabilia. I’ve visited Francis and wondered how he had room enough to live; no, not only spectrometers under the bed, they are everywhere – kitchen, passageways, conservatory, the garage(s). I promised last time to produce Article II of "How does FTIR work?" and I have to apologise. Rather than produce a load of old verbiage I have decided to make Article II a sort of tutorial you can run through on your own FTIR. Fortunately, Fabrice Birembaut has volunteered (?) to give me a hand but this type of thing takes a little time. You will see it next Edition – promise!! Following Perkin Elmer’s decision to cease sponsorship of the Journal at Easter –to attract new sponsors and advertisers (if we decide to include advertisements) it is essential that the Journal readership be as large as possible. Could you please urge all your friends and associates to register as readers with us? We really do need numbers – and remember it doesn’t cost anything! List of email addresses - readership It is clear that the list of email addresses is very
attractive to possible sponsors. In the past, Perkin Elmer have had access
to the list because they "owned" the Journal and could have used the list
to send you information on their products. I don’t think they used it very
much. However, future sponsors might well want the list and would want to
send you information via email. To be completely fair to you – please tell
us if you wish your address to be withheld from a sponsor or advertiser.
We will erase it from the list which is used by the sponsor, retaining
your name on our subscriber list so we will still email you when we
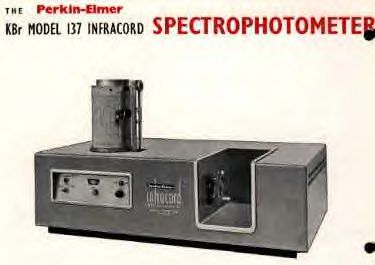
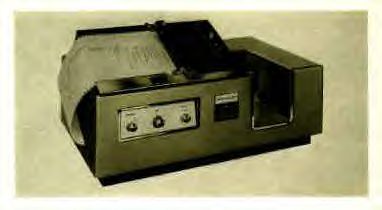
publish a new edition. 3. Perkin Elmer’s Infracord Infrared Spectrometer Those of us with long memories are well aware of the revolution the ‘Infracord’ made in infrared practice. When I was flogging away at my PhD research, I used a nearly new Hilger H800 – a monstrous contraption built in the UK. This instrument worked well enough but it was incredibly large and unbelievably heavy and was rather slow. The optical unit was the size and weight of a medium sized coffin (complete with occupant) and the electronics were housed in a floor mounted be-wheeled casing ~1½m high. Around 1959 we (my supervisor, the late Don Powell and I) were loaned an Infracord so that we could "give our opinion" of its merits. Well immediate reactions were negative – small, light, tinny and obviously horrible, but the snag was that it worked as well as the H800. Regardless – we didn’t like it – everyone knew that research grade instruments had to be massive or they weren’t research grade instruments! How wrong we were! Dr. Mike Ford, probably the leading figure in demonstrating that small is beautiful in IR as it is in so much else has written a piece for us on the development of this genuinely epoch making machine. A thought – back in the 1950’s, 60’s and 70’s P-E produced the Infracord (1958), upgraded it in 1959, sat back in 1960 and then offered a UV variant in 1961. To keep their competitors on their toes they improved the design in ’62, ’63 and again in ’64 and upgraded in ’65 and ’66. Clearly, this wasn’t fair so they let the other lot catch their breath for 3 years and then hit the market again and again with new products in the 1970’s. This record seems to me to be more like that of the motor industry. I sense that in the IR field things don't develop like this these days. Could this perhaps be the main reason why the industry has become staid and mature? [See report on IRDG meeting in last edition]. Mike’s fascinating article is below and I recommend it to you all.
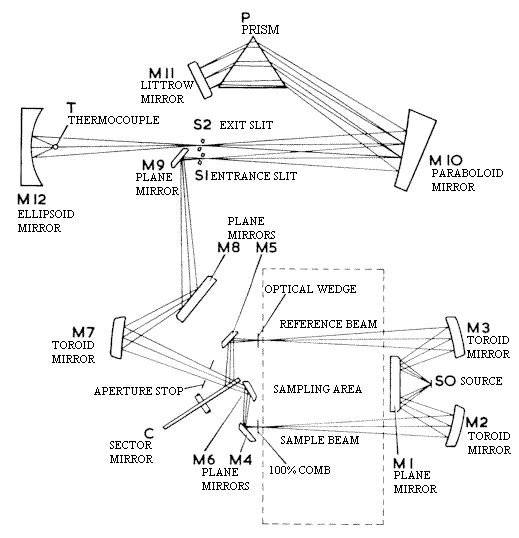
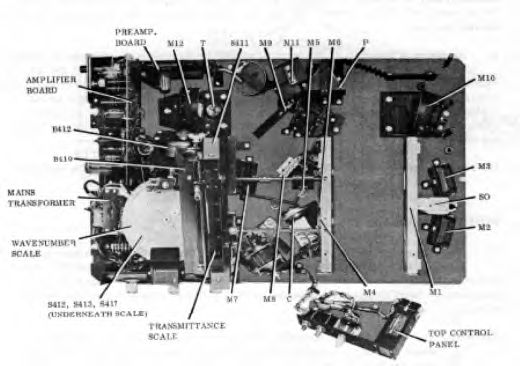
It was probably in early 1954 that the first inklings of an idea began to form. Some observant people in the company had noticed that many users of the current main Infrared product, the large, research grade model 21, made little use of the range of resolution and scan speeds offered, but settled for one - mostly the same - set of conditions all the time. So why not give up the expensive options and make a much cheaper instrument giving only those conditions? After some tossing about, the idea began to gain acceptance, and to it was added the concept of further reducing the cost by adopting a radically different approach to the construction of the instrument - using parts stamped from sheet metal instead of the traditional castings. There was some scepticism about this approach, and adequate stability for the optics using a sheet steel plate stiffened with a box structure underneath had to be successfully proved. To keep the instrument compact it was decided to use a high aperture, short focal length monochromator which demanded use of aspheric optics to achieve adequate resolution. Although Perkin-Elmer possessed the necessary skills for making aspherics, they had never before been made in the now projected numbers, or for the low cost required, but there was sufficient confidence for the project to be given the 'go ahead' (see footnote). Under the leadership of John Atwood, with Hamilton (Ham) Marshall responsible for the optics and Tom Flynn the electronics, the instrument was well advanced when I joined Perkin-Elmer at Norwalk in the United States in October 1956 (I was involved in other projects for the next six months). In addition to the sheet metal construction, there were many innovative and simplifying features. These included the use of etched foil for the slits and wedge attenuator and a single shaft carrying the recording drum and the scan and slit drive cams, driven by cable and cams to give (roughly) a constant time interval for each resolution increment. In addition, Kurt Opperman designed a new type of source, a ceramic tube with an internal rhodium (later platinum/rhodium) heater, to be simpler than the usual globar or Nernst filament. The first instruments had two scan speeds - 3 and 12 minutes for the full range - and a single slit (resolution) programme The name 'Infracord' was an obvious extension from the existing 'Spectracord' UV spectrometer, but the origin of the model number 137 is probably lost for ever. The introduction at the 1957 Pittsburg meeting was a great success, although it transpired that two other companies, Beckman and Baird had new products aimed at much the same market. - I well recall arguments, and probably bets, between representatives of the three companies as to who would sell the most; history shows a very clear answer! When Perkin-Elmer Ltd was set up in August 1957, it was decided that the Infracord would be the first product, and I returned to England with the full drawings and a part assembled instrument in my luggage. Since there was no habitable space in the company's building, a derelict factory in Beaconsfield, I begged the use of a tiny lab at King's College to do the final assembly and test. Once some space had been converted into something more appropriate, three instruments were built from sets of parts imported from the USA, while UK made components were being procured - import regulations at that time limited us to importing a maximum of 30% of the parts value, which was almost fully absorbed by the aspheric optics and printed circuit board (we were unable to obtain double sided, plated through boards here). The first of the 'fully' UK instruments was shipped in March 1958 and a total of 12 were made at Beaconsfield in that year, while about 140 were made at Norwalk.
Problems & Improvements There were a few hiccups along the way. An early problem to arise concerned the temperature compensation. To save cost, the instrument was not thermostatted like previous models and, to correct for the change of refractive index of the rocksalt prism, a bimetal strip was incorporated in the scanning mechanism. The corrective effect was inclined to stick, resulting in erratic calibration. Fortunately, the problem had already been recognised at Beaconsfield and a solution incorporated before it became so serious at Norwalk that all shipments were stopped - the Americans then accepted the modified design with such alacrity that shipments were resumed within a week! A chance observation when aligning instruments led to the realisation that the best focus in the infrared was different to that at the wavelength of the mercury lamp used for alignment. After the cause of the effect was found, the magnitude of the difference was calculated and a jig made to alter the focus by that amount, giving a marked benefit. Numerous other minor improvements were made, the most
obvious being the increase of the ordinate scale from four inches to six
inches and the addition of a limited range of slit programmes, before
major changes required a new model number *- the first of a long series of
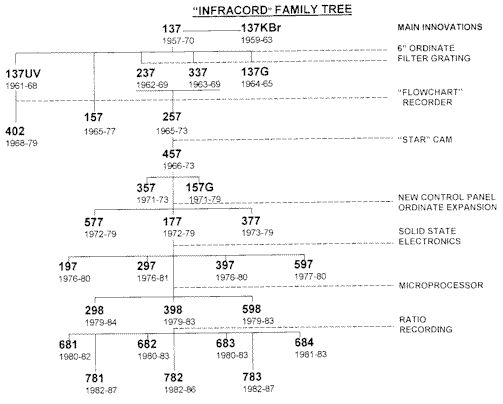
progeny of the original 137. The first Progeny Rather surprisingly, the first of the progeny was a UV version, the model 137UV - later the 402 - created by changing from the rocksalt to a fused silica prism, with the thermocouple replaced by tungsten and deuterium sources and the detector by a photomultiplier. In addition, a logarithmic 'wedge' attenuator was used to give an absorbance scale on the recorder. The development was started in the USA, but completed at Beaconsfield, and the instrument shipped from 1961 to 1979, the longest life of any of the 137 series. Diffraction Gratings, not Prisms We all knew that gratings were readily available which would give the instrument much better performance than the rocksalt prism. The problem was that a grating at a given angle reflects not just one wavelength (referred to as first order) but also multiples of that wavelength (second order and so on). To select only the needed order required either an extra prism, for which there wasn't room, or filters. Thus, it was the development of suitable filters which gave us the opportunity to design the next on the 'Family Tree', the first of the filter grating instruments, the 237 (4000 - 625cm-1) and 337 (4000 - 400cm-1). Each of these used two gratings in first order and a mechanical cosecant drive -a geometrical linkage which moves the gratings to give a linear wavenumber scan - in place of the scan cam.
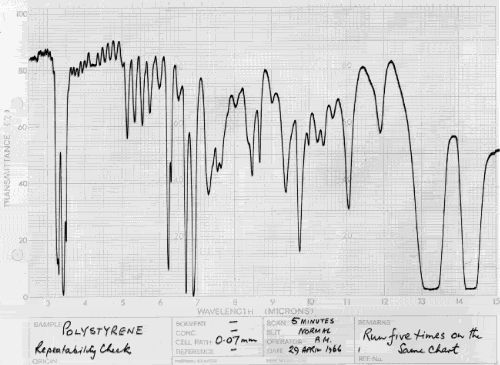
'Flowchart' Recorder The concept behind the Beaconsfield development of the 'Flowchart' (sprocket driven chart) recorder was to remove the dependence upon the operator correctly aligning the pre-printed chart on the recorder drum and eliminate the sensitivity to chart stretch or shrinkage. In addition it provided the ability to perform abscissa scale expansion. Since the wavenumber accuracy of the instrument depended on the alignment of the printed grid with the perforations which drove the chart, it was essential to find a chart printer who could meet the necessary, very tight tolerance; such a supplier was finally found in Germany. It proved very successful and was applied to all later models, starting with the 157(the last of the prism instruments, made until 1977) and 257, essentially the 137 and 237 with the new recorder.
'Star' Cam At first sight, this might seem a trivial innovation, but it was, in fact, very significant. In order to further extend the range of the 257 it was necessary to use one grating in both first and second orders and a second grating in first order only. While this would have been possible with the existing scan drive, it would have been complicated and would have extended the total scan time. By using a three-lobe scan cam in the shape of a three-pointed star, the full range could be covered in a single rotation of the cam shaft. A first, rough calculation of the cam shape indicated slopes so steep that many believed it could not possibly work - but it did!- and the first outcome was the 457 with a range of 4000 to 250cm-1. In operation the cam rotation was continuous, with the chart uncoupled and pen deadened while tracking the cam return zones and with simultaneous filter and grating change. Later, restricted range, lower cost versions followed; the 357 (to 400cm-1) and the 157G (to 625cm-1). The addition of ordinate expansion - by putting gears between the wedge attenuator and the pen drive - and more user friendly controls were the next step, approximately replacing the 1,3and 457s with the 1,3 and 577s. (newly developed filters allowed the range of the 577 to be extended to 200 cm-1). Solid State Electronics Up to 1976 the original valve (vacuum tube) signal handling electronics had remained almost unchanged since they had continued to function reliably, but they were increasingly 'old fashioned' and bulky and were finally replaced with a 'modern' solid state system. The outcomes were the 2,3 and 597s, with ranges to 600,400 and 200cm-1 respectively, plus the 197, a simpler, lower cost version of the 297. Microprocessor In the models 2, 3 and 598, introduced in 1979, a microprocessor controlled the scanning parameters (not the signal handling) but, more importantly, it provided full external computer compatibility. These instruments were replaced only a year later by the first of the low cost RATIO RECORDING models. The 681, 2 and 3, as before, had spectral ranges to 600, 400 and 200cm-1 and, in addition, there was the 684, which incorporated pre-sample chopping to prevent the error in ordinate accuracy arising from the infrared radiation emitted by hot or warm samples. Ratio Recording Prior to the 680 series, all instrument versions had used the optical null principle, in which the reference, or background, beam is attenuated to match the attenuation caused by the sample, with the recording pen coupled to the variable attenuator. With ratio recording, sample (S) and reference (R) signals are measured separately and the ratio S/R plotted by the recorder. This gives many advantages over optical null, too numerous to detail here. In the 680 series the signal from the thermocouple was digitised and all further processing was digital in a second microprocessor. Quite a complex calculation was performed in order to minimise the problem that, in a fast scan, the background energy could change significantly between 'sample' and 'reference' in the same chopping cycle. In addition, users were not accustomed to having the recorder become 'noisy' in regions of high background absorption, rather than going 'dead' as in optical null instruments. To overcome this objection the option of 'pseudo optical null' was provided, which increased the time constant in such regions, but without any lag in the written position on the chart. The Last of the Progeny Although many of the features of the original 137 continued to be used, the 780 series (similar to the 680s with added features) must be considered to be the last of the true progeny, as later models reverted to a cast base rather than the sheet metal construction, a change made economic by advances in manufacturing methods. Over the lifetime of the series, from the introduction of the 137 in 1957 to the final shipment of 780s in 1987, over 12,000 instruments were produced. Later, all the grating (dispersive) instruments were replaced by Fourier Transform models, although they are still preferred for some specialist applications. But that is another story.
Acknowledgements Footnote REF: M. Ford, Int.J.Vibr.Spec., [www.ijvs.com] 6, 1, 4 (2002)
|